 Skip to content
SUBSEA PIPELINE INSPECTION & LEAK DETECTION · TORRES STRAIT
Torres Strait Freshwater Pipeline Leak Inspection
QOffshore combined high-resolution MBES bathymetry with targeted salinity measurements to identify the most likely active freshwater leak location for Tailored Spatial Solutions.
Client
Tailored Spatial Solutions
Region
Ellis Channel, Torres Strait, QLD
Fieldwork
23–25 January 2026*
QOffshore role
Pipeline inspection survey support
Service
MBES + salinity verification
Outputs
DTM, anomaly locations, salinity & charts
Survey area
207,524 m²
Target
Suspected freshwater leak
The client issue
Tailored Spatial Solutions needed to investigate a suspected leak in the freshwater pipeline linking Thursday Island and Horn Island through Ellis Channel. Because most of the pipeline was buried, the challenge was not simply to trace the asset; it was to recognise seabed evidence of leakage and distinguish a credible leak signal from other anomalies.
The practical question was which location showed the strongest evidence of an active freshwater leak, and how that interpretation could be independently strengthened in strong tidal currents.
207,524 m²
Survey area
107.2 million
Accepted soundings
3
Locations investigated
33.25 → ~3 PSU
Salinity at Location 1
The survey challenge
01
Mostly buried asset
Approximately 80% of the pipeline was buried, limiting direct inspection and making seabed disturbance an important indirect indicator.
02
Strong currents and weather
Marginal conditions and strong tidal flow complicated survey operations and stabilising the salinity sensor near the seabed.
03
Multiple anomalies
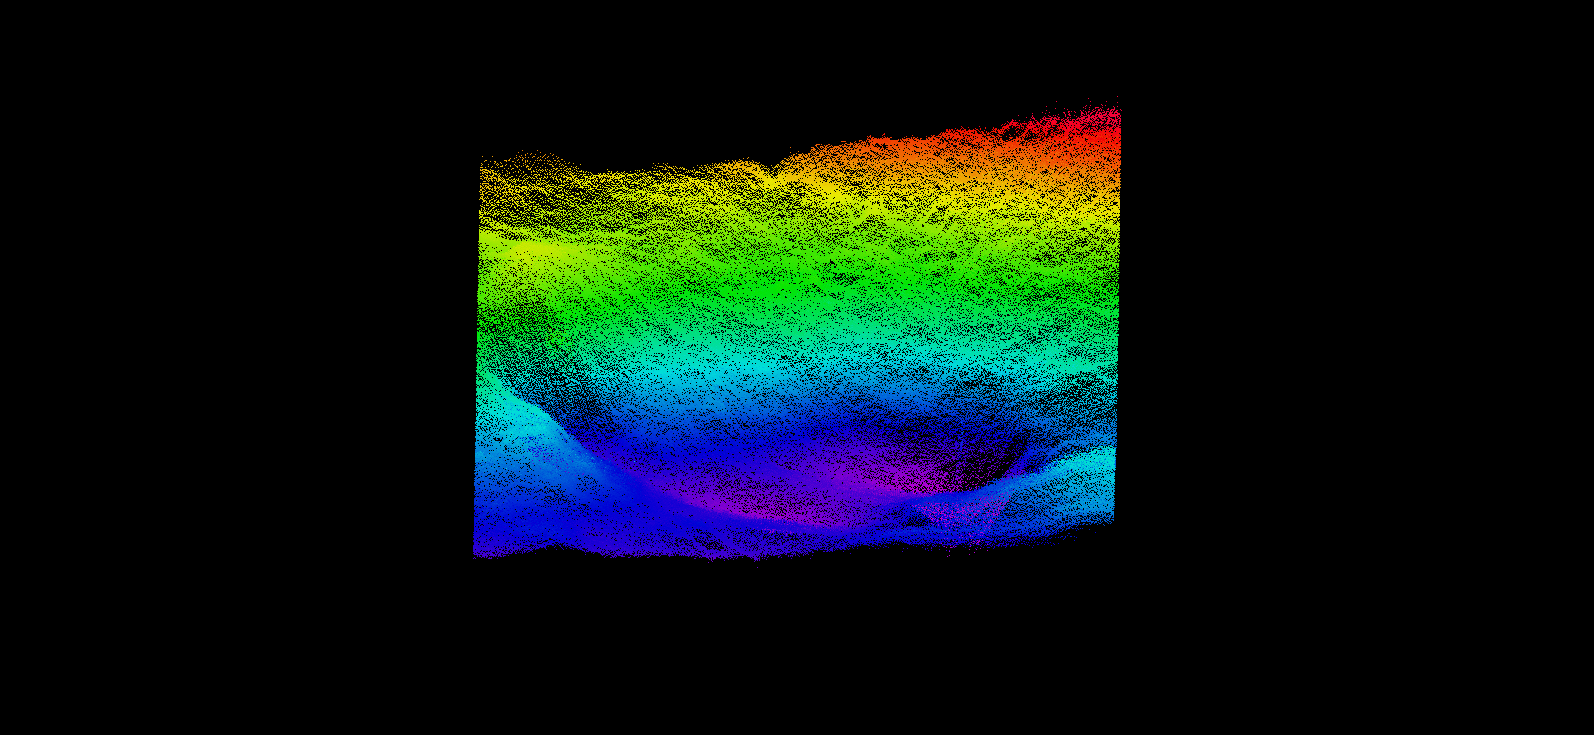
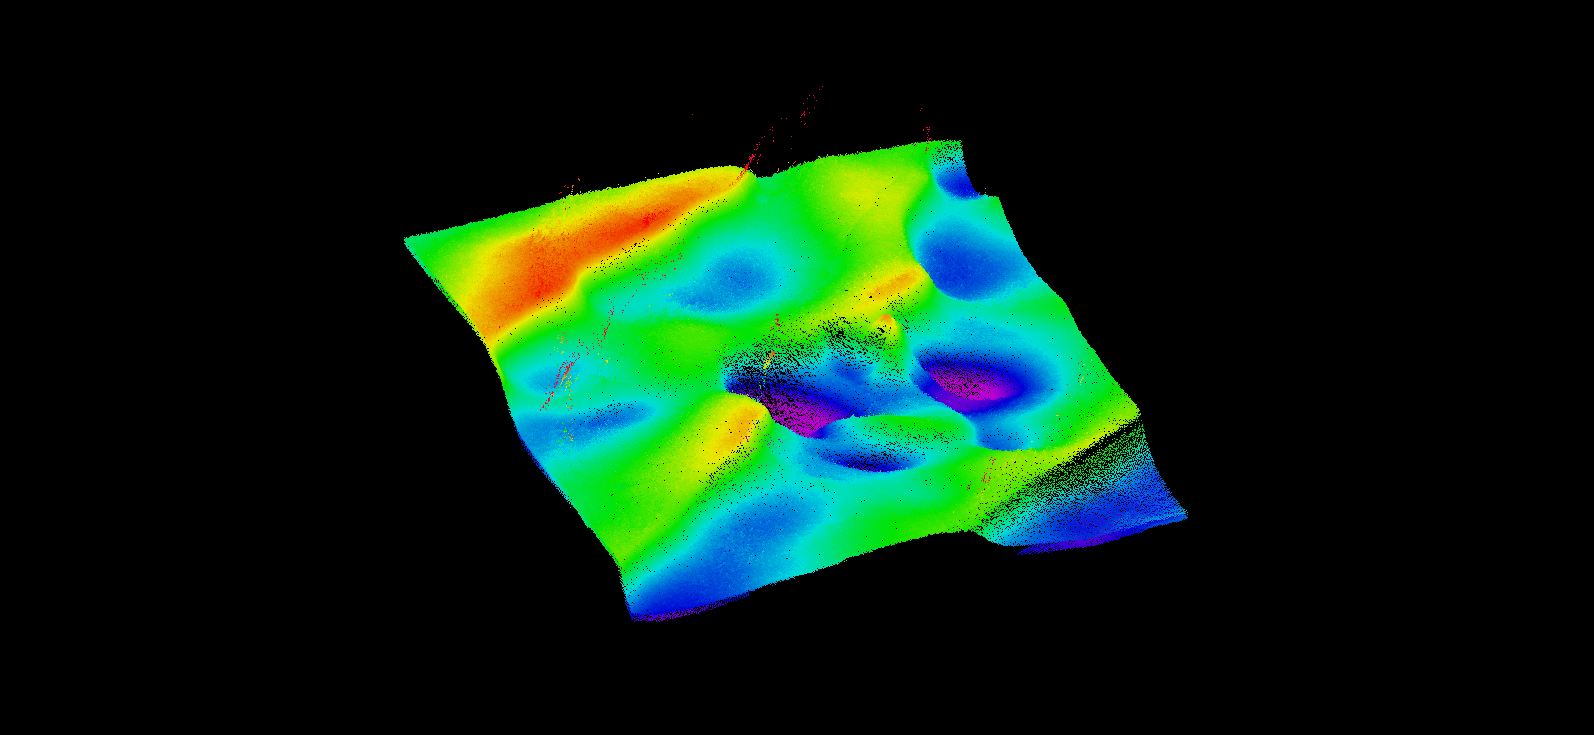
MBES processing identified three locations of interest, requiring a second line of evidence to rank their likelihood.
Survey delivery
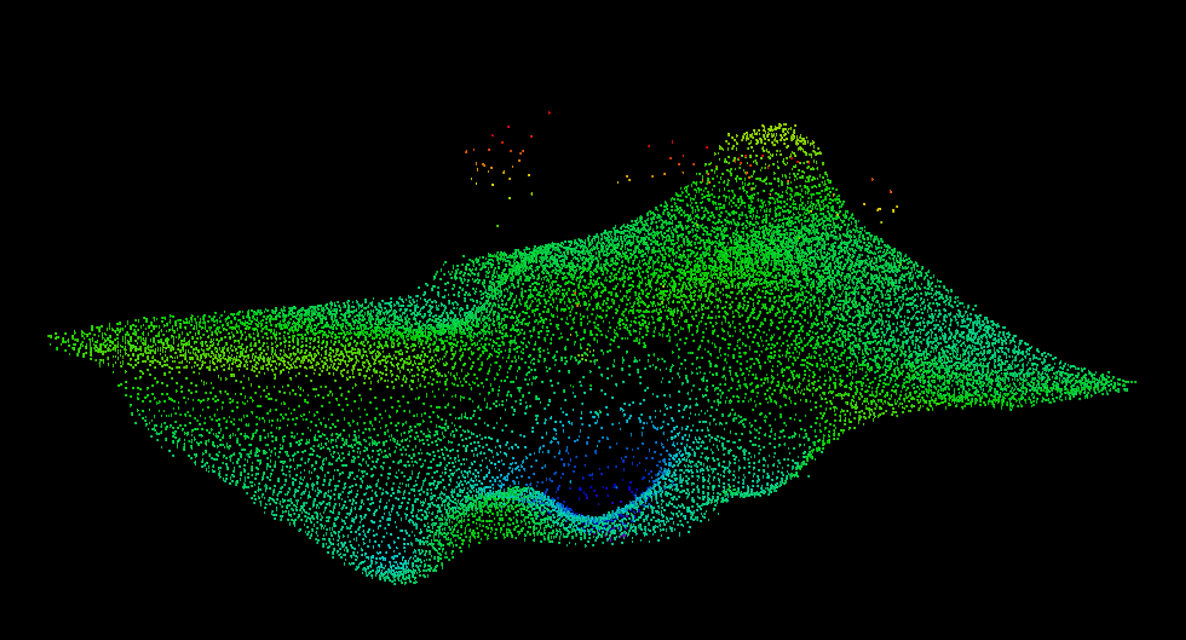
QOffshore supported Tailored Spatial Solutions with a targeted inspection workflow combining NORBIT iWBMS bathymetry, Qimera seabed interpretation and uvSVX salinity checks. MBES first highlighted three locations of interest; salinity was then measured close to the seabed at each location to test for a freshwater signature.
Map the pipeline corridor
Acquire and process high-resolution MBES along the mapped freshwater pipeline alignment.
Identify anomalies
Review seabed morphology and isolate disturbances close to the expected pipeline position.
Verify with salinity
Deploy the salinity sensor at each location and compare near-seabed readings with background seawater.
Prioritise the evidence
Combine morphology and salinity results to identify the highest-likelihood leak location and report limitations.
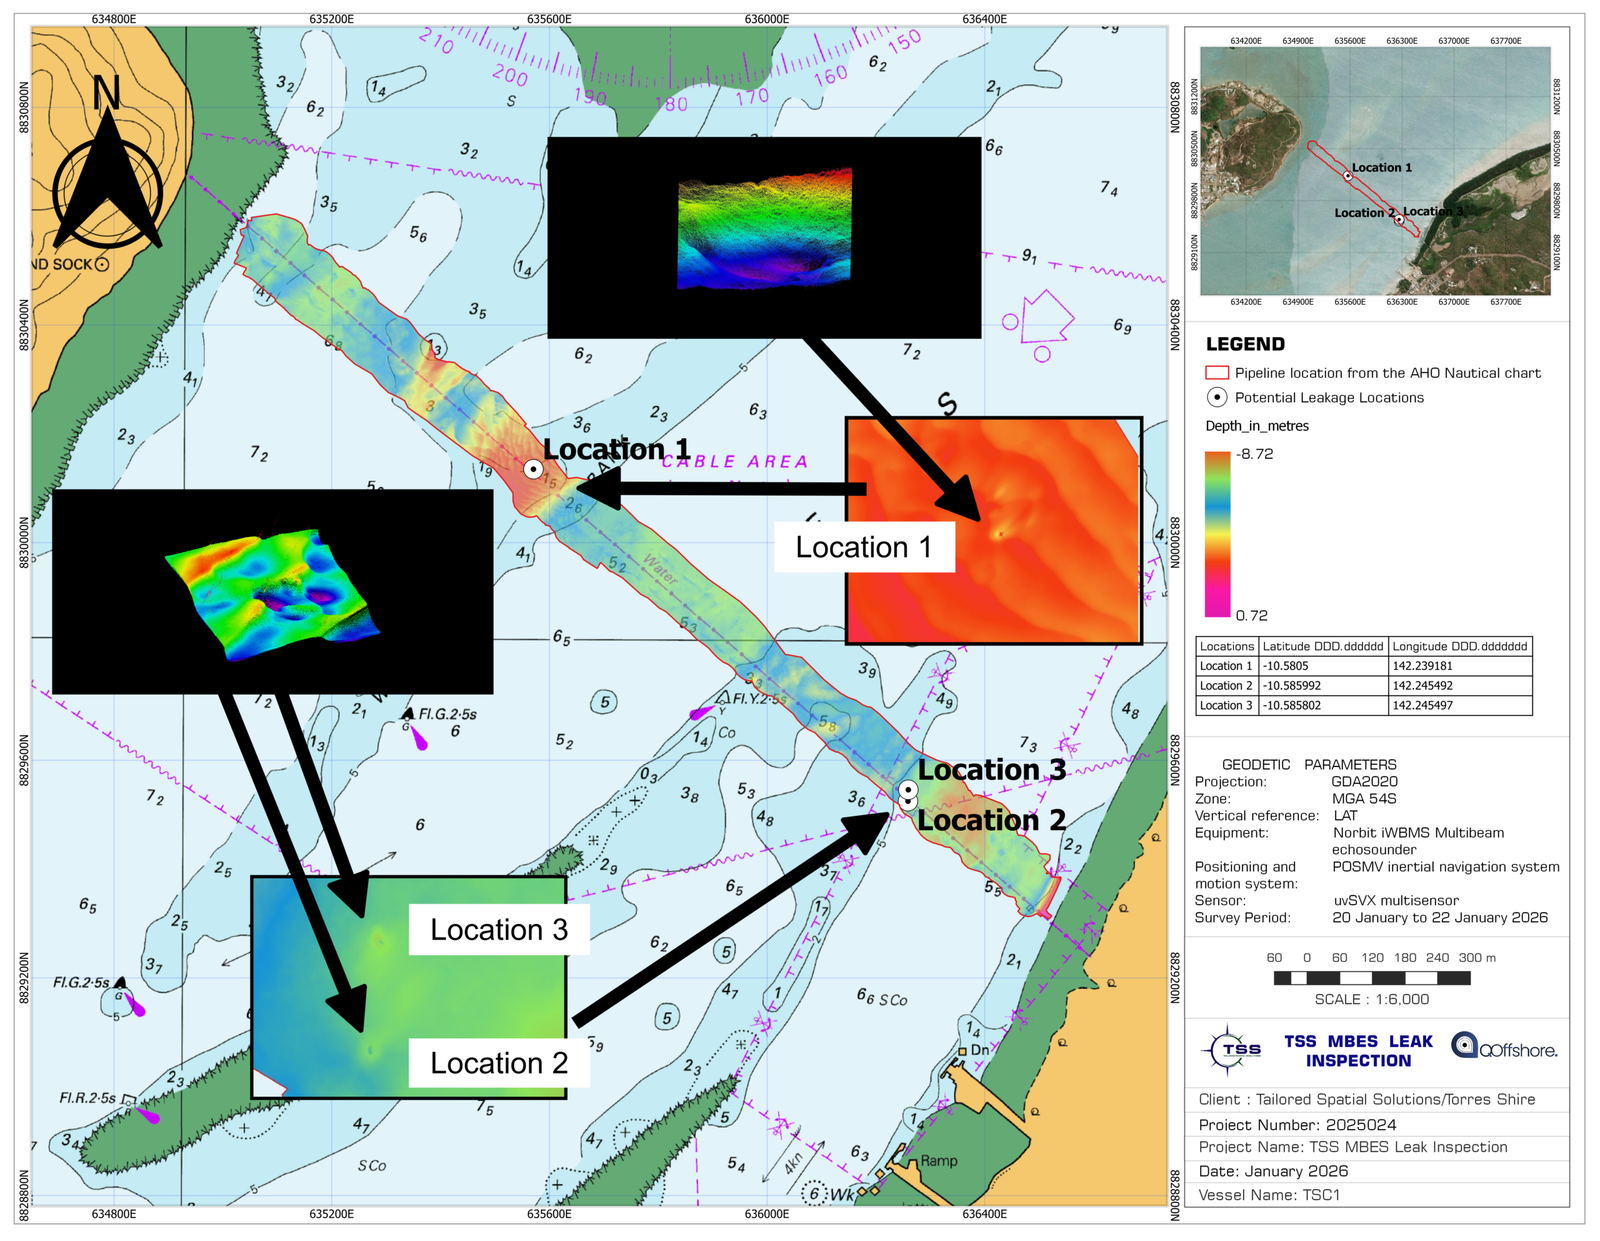
Survey chart
Outcome and client value
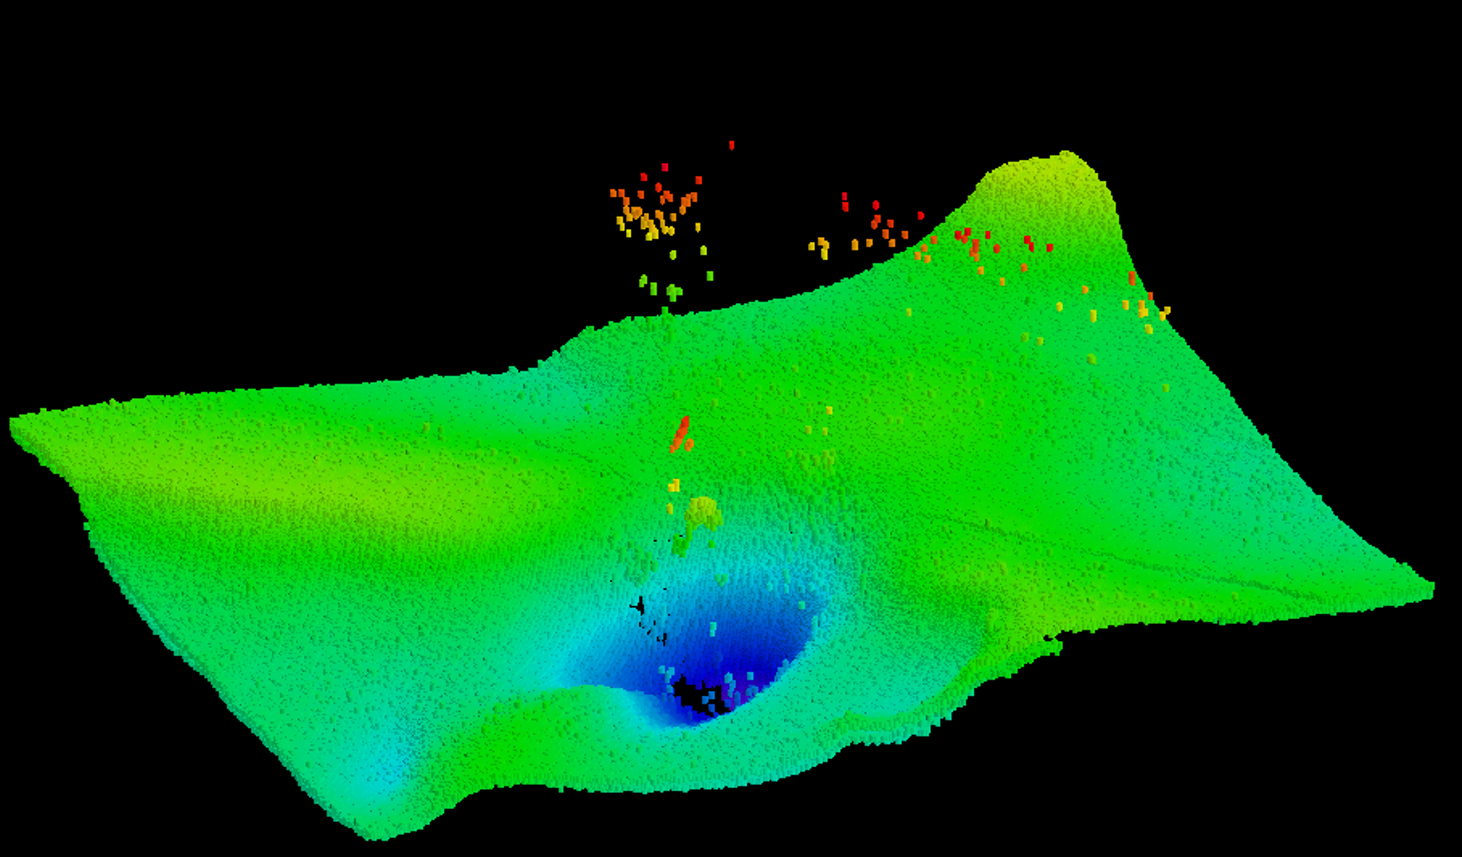
Location 1 showed the clearest combined evidence of active leakage: a pronounced seabed disturbance close to the pipeline alignment and a repeatable salinity drop from about 33.25 PSU to nearly 3 PSU.
Locations 2 and 3 showed weaker seabed disturbances and no significant salinity anomaly, giving Tailored Spatial Solutions a focused evidence base for subsequent inspection and repair planning.
Survey deliverables
- 0.25 m DTM of the pipeline corridor
- Mapped anomaly and potential leak locations
- Targeted salinity confirmation at three locations
- Pipeline-status and integrity-risk observations
- Leak-location, DTM and contour chart set
Why it mattered
The investigation moved from a broad suspected leak to an evidence-backed priority location by combining two independent signals: seabed morphology and freshwater salinity.
Location 1 showed the strongest seabed disturbance and the clearest repeatable freshwater salinity signature. This provided a focused basis for subsequent inspection and repair planning.
Explore our hydrographic survey services for bathymetric mapping and seabed interpretation.
Client testimonial
“QOffshore were great to work with – professional, safety-focused and practical. The team combined detailed bathymetry with targeted salinity checks and gave us clear evidence to focus the investigation on the most likely leak location.”
Craig Genga
Director | Chief Remote Pilot
Tailored Spatial Solutions
