 Skip to content
Marine survey projects often generate large volumes of tide-gauge, GNSS and environmental observations that must be checked, corrected and aligned before they can support engineering decisions. The value of automation is not simply that it runs calculations faster. A properly designed workflow applies the same controlled processing sequence to every dataset while preserving the technical judgement and QA/QC required from an experienced hydrographer.
QOffshore develops tailored marine survey data-processing workflows for recurring and data-intensive tasks. These tools combine hydrographic domain knowledge with repeatable calculations, traceable quality checks and standardised outputs.
Why tidal and GNSS processing becomes complex
Pressure tide gauges record the total pressure acting at the sensor. Converting those observations into a dependable water-level series requires more than exporting values from the instrument. The workflow may need to account for atmospheric pressure, instrument calibration, time synchronisation, sensor stability, temperature response, outliers and the relationship between the gauge reference and the required vertical datum.
When GNSS buoys are observed above bottom-mounted tide-gauge nodes, the two datasets also need to be synchronised and compared within a consistent time and reference framework. This makes it possible to estimate the relationship between the ellipsoidal reference surface and the project tidal datum, including Lowest Astronomical Tide (LAT), subject to the duration, quality and purpose of the observations.
What can be automated
A well-designed tidal-processing workflow can automate repetitive operations while retaining review gates for the decisions that require specialist judgement. Depending on the instruments and project requirements, the controlled sequence can include:
- importing and standardising tide-gauge, barometer and GNSS files;
- checking file completeness, timestamps, sampling intervals and units;
- applying instrument calibration coefficients;
- assessing clock offsets and time drift;
- correcting pressure observations for atmospheric pressure;
- testing pressure-sensor stability and potential drift;
- reviewing temperature and pressure relationships;
- identifying outliers and data gaps using defined rules;
- applying appropriate filtering, including Kalman filtering where justified;
- synchronising tide-gauge and GNSS-buoy observations;
- performing regression and residual analysis;
- undertaking Van de Casteele assessment where applicable;
- considering seasonal mean sea-level variability within the project methodology;
- calculating and validating the ellipsoid-to-tidal-datum relationship; and
- generating standard plots, tables and QA/QC records.
Synchronising tide-gauge and GNSS observations
The strongest part of an automated workflow is its ability to apply an identical, documented treatment to every node. Once timestamps, reference points and corrections have been validated, overlapping tide-gauge and GNSS-buoy observations can be paired for comparison.
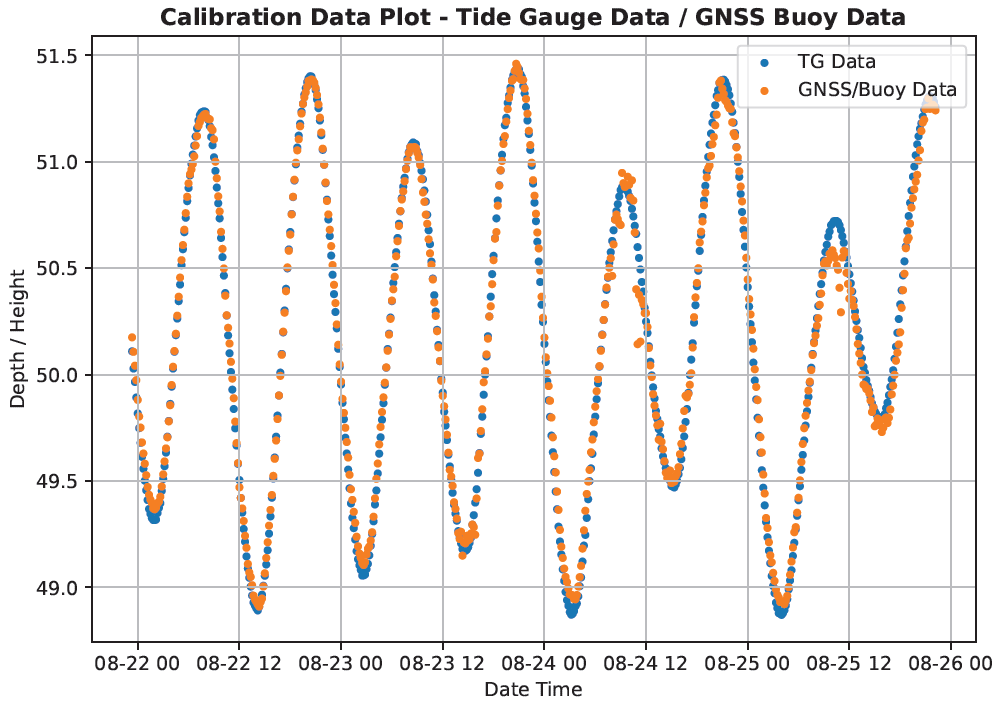
Example of synchronised tide-gauge and GNSS-buoy observations following correction and alignment.
The paired series should be assessed for agreement rather than accepted solely because the curves appear similar. Regression analysis helps identify scale, offset and systematic behaviour, while visual inspection remains important for recognising localised deviations or poor-quality observation periods.
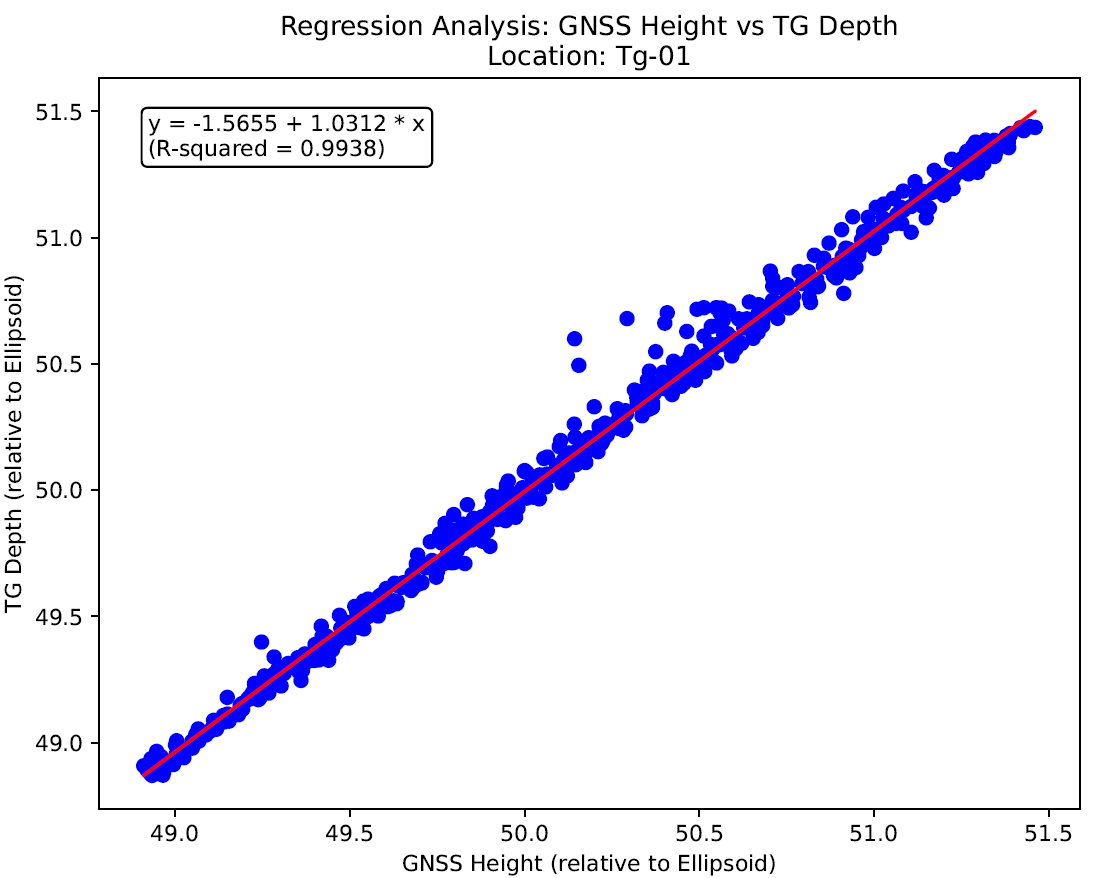
Regression analysis used to assess the relationship between GNSS ellipsoidal height and corrected tide-gauge observations.
Residual analysis and quality assurance
Residuals provide an important independent check on the fitted relationship. Their distribution, magnitude and behaviour through time can reveal outliers, timing problems, sensor drift or periods when the observations should not be used. A statistically neat result is not sufficient on its own; it must remain consistent with the instruments, field methodology and expected tidal behaviour.
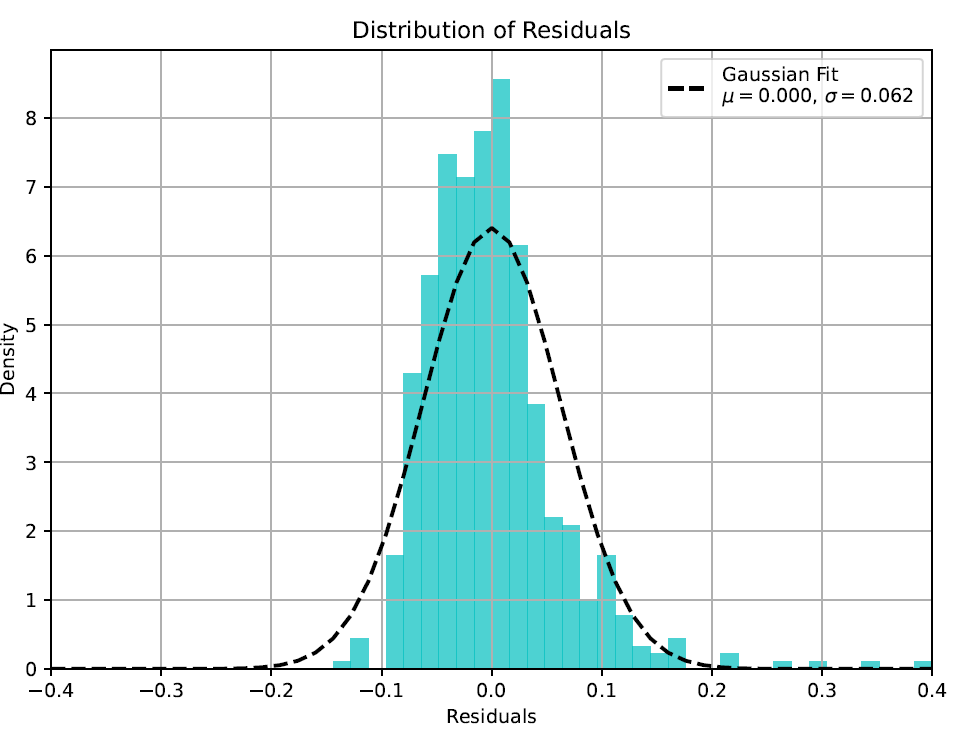
Residual analysis provides a documented QA/QC check on the final relationship.
Automation does not replace hydrographic judgement
Automation can consistently execute a defined processing methodology, but it cannot decide whether that methodology is suitable. The acceptance limits, correction sequence, filter settings, exclusion rules and datum interpretation must be established by personnel who understand hydrography, geodesy, oceanography and the limitations of the instruments.
This distinction is critical. A generic script may process files quickly while producing a technically invalid result. A domain-led workflow records why each operation is performed, retains the original observations, provides intermediate QA/QC outputs and allows every derived result to be traced back to its source data and processing parameters.
Benefits of a tailored processing workflow
For organisations that repeatedly deploy the same tide gauges, barometers and GNSS equipment, a tailored workflow can provide substantial operational value:
- consistent treatment across every tide-gauge node;
- faster identification of incomplete or poor-quality observations;
- reduced repetitive manual handling;
- traceable corrections and processing decisions;
- repeatable figures, calibration records and deliverables;
- simpler reprocessing when parameters or requirements change; and
- a reusable methodology for future projects.
QOffshore’s approach
QOffshore combines hydrographic and geodetic expertise with data automation to develop workflows around the client’s actual equipment, file formats and deliverables. Our approach starts with the technical objective and quality requirements, then defines and tests every processing step before it is automated.
The outcome is not a black-box result. It is a controlled and auditable workflow that helps clients process complex marine datasets efficiently without removing the specialist review required for engineering use.
To discuss tidal data processing, GNSS datum integration or a tailored marine-survey automation workflow, contact QOffshore Services.
