Qmap is Qoffshore’s innovative web-based mapping and data visualization platform designed to support hydrographic, geospatial, and marine projects. Built on the latest web technologies, Qmap provides an intuitive and interactive interface for professionals to explore, analyze, and interpret hydrospatial data with ease.
Qmap is tailored for hydrospatial professionals, offering a seamless experience in visualizing and managing marine and geospatial data efficiently. Whether you are tracking survey operations, monitoring offshore structures, or analyzing environmental changes, Qmap empowers you with the tools needed to make data-driven decisions.
Key Features of Qmap
- Dynamic Geospatial Mapping
Visualize hydrographic survey data, bathymetry, and topographic information in an interactive environment.
- Real-Time Data Access
Integrate sensor feeds and live GNSS data for real-time monitoring and decision-making.
- Weather and Oceanographic Layers
Leverage integrated weather APIs to view wind, wave, and tide predictions alongside survey data.
- Mobile & Desktop Accessibility
Access Qmap on multiple devices, ensuring flexibility for field and office operations.
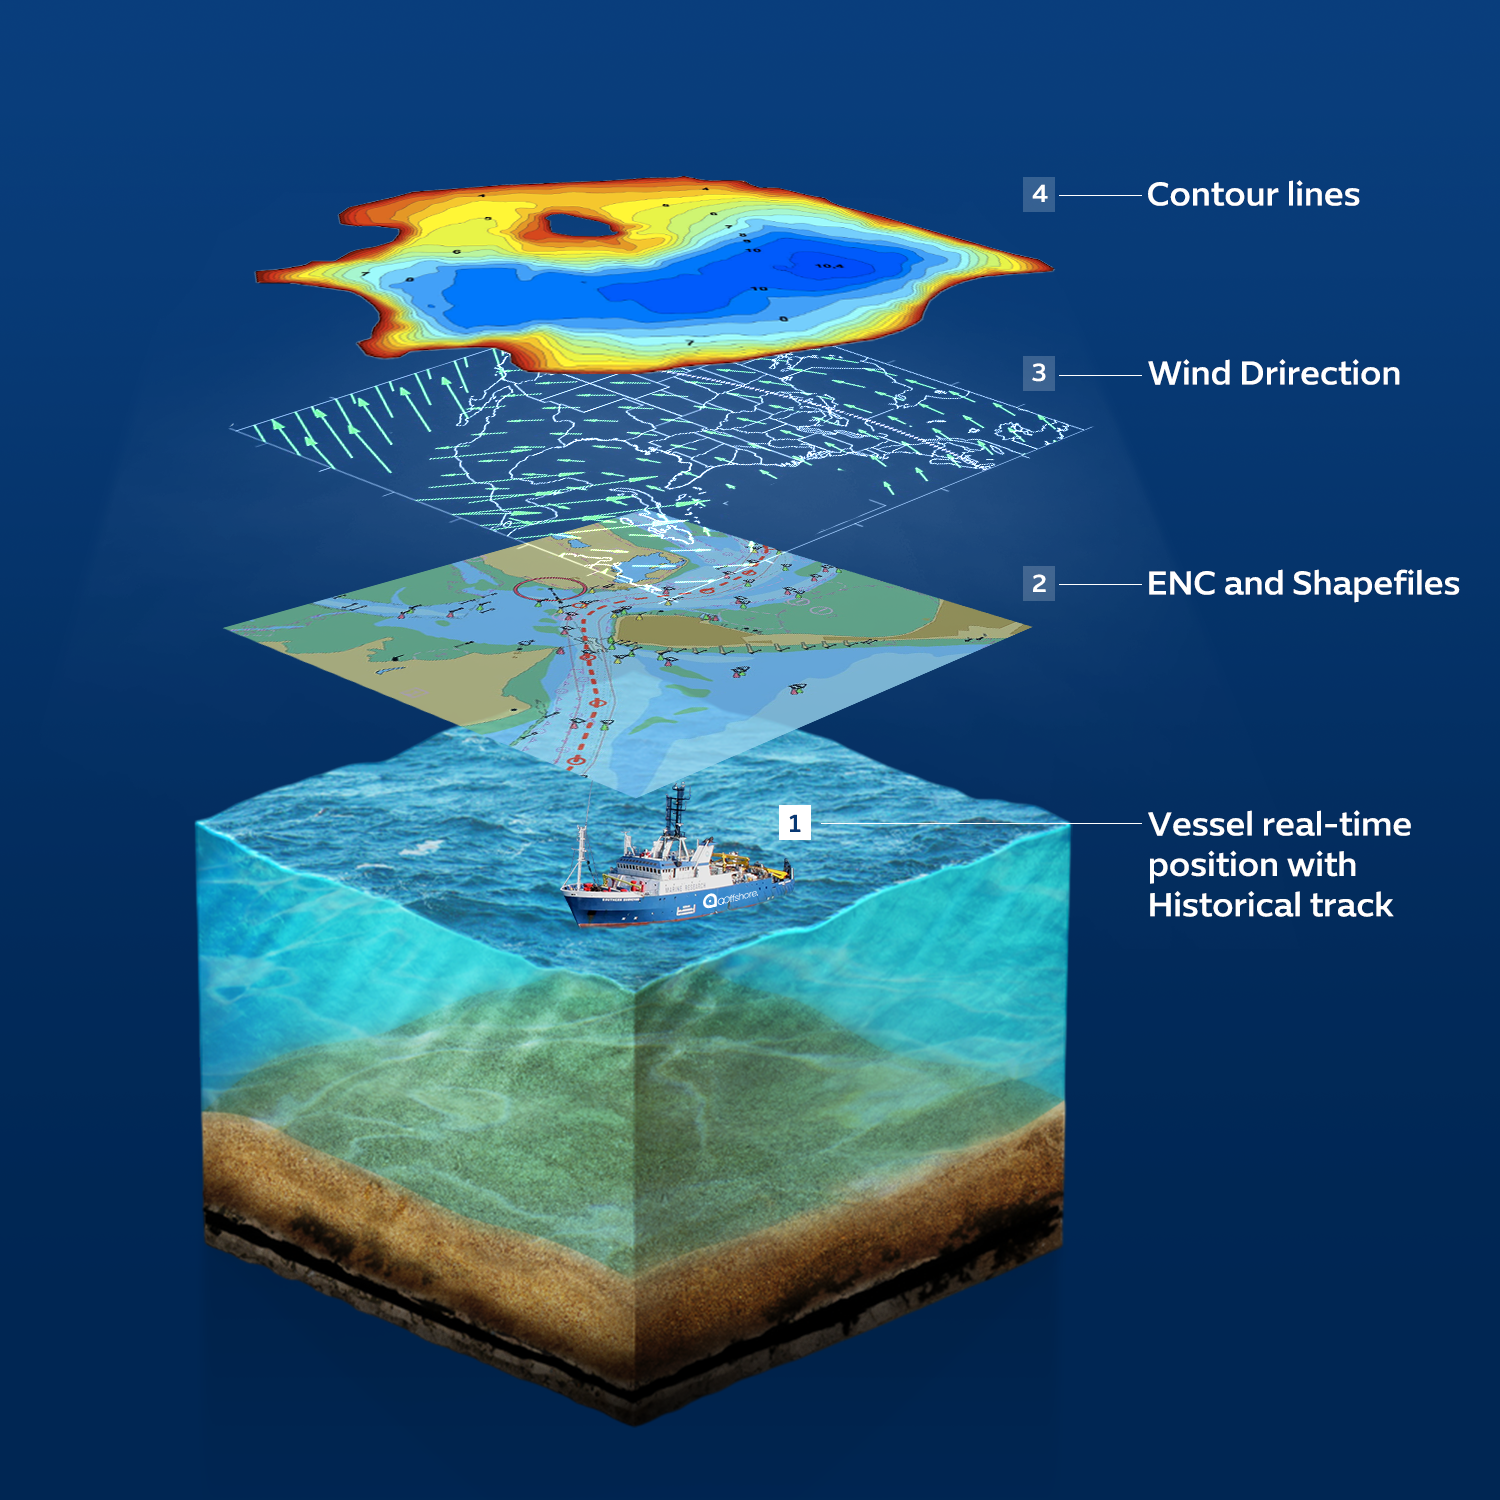
- Multi-Layer Integration
Overlay multiple data sources, including satellite imagery, nautical charts, and environmental datasets, to gain comprehensive insights.
- Custom Data Uploads
Upload and display custom datasets, including DTMs, polygons, and surveyed points.
- Collaboration & Sharing
Securely share mapped results and insights with team members and stakeholders.